
It’s too late to ignore loyalty program modeling.
Whether you manage a local program or an international program, you likely already have thousands (if not millions) of loyalty program members. In fact, data has shown that 30 - 50% of hotel room nights are purchased by loyalty program customers. And international airlines realize as much as 44% of total revenue from frequent flyer programs.
It’s clear that loyalty program liabilities and revenues represent significant balance sheet and income statement accounts. Unfortunately, these financial items are based on member behavior and can be hard to predict and budget.
But as the saying goes, failing to plan is planning to fail.
For example, it’s critical to accurately estimate breakage (the percentage of points that will ultimately go unredeemed) in order to defer the correct amount of revenue for each reporting period.
Budgeting for your loyalty program draws out important considerations:
The solution is to build a financial forecast for key loyalty program metrics.
A robust model with prudent assumptions allows program managers to quickly run forecast scenarios, where multiple program variables can be estimated or adjusted as inputs. The result is an intelligent, responsive framework with which to examine your loyalty program’s performance under different breakage rates, member growth, and other key variables.
In this article, we’ll walk you through the steps needed to analyze, build, and assess financial modeling for your loyalty program. These include:
Estimating these metrics not only provides you with a clearer picture of your loyalty program, it helps you better predict your program’s financials. To help you along the way, we’ve developed a model financial forecast, found near the end of this article.
Let’s get started.

The first step to building a financial forecast is to estimate when current outstanding loyalty program points are expected to be redeemed (or, in some cases, expire). Point “runoff” refers to one of two events:
The running total of unredeemed and unexpired member points represents your growing program liability. These points will eventually either incur a cost or result in breakage.
Calculating ultimate redemption rate (URR) helps identify what percentage of points will ultimately be redeemed. However, it’s important to accurately estimate the timing of point redemptions.
A projected redemption pattern can help predict the timing of:
Robust actuarial analysis can generate a projected redemption pattern which, when summed, equals the URR for those points. The result of this predictive modeling analysis is an estimated runoff schedule of outstanding points - a forecast for when points are expected to be used or expire unspent.
For example, consider you have a program with 100 outstanding points and a breakage rate of 25%.
This means that the URR is 75% and that 75 of the 100 points will be redeemed. While it’s useful to know how many points will be redeemed, it’s ever more helpful to know when they’ll be redeemed. A runoff schedule will forecast the cadence at which these points are redeemed or expired (e.g., 5 points in redeemed January, 4 points redeemed in February, and so on). The alternative is looking blindly towards the future.
Additionally, the runoff schedule will provide you with an estimate of the percentage of your liability expected to be redeemed within the next calendar year. This split between current and non-current is often reported in company financials, including those for frequent flyer programs and hospitality programs.
It’s worth noting, that under the new ASC 606 and IFRS 15 standards, revenue can now only be recognized once the performance obligation has been fulfilled. For example, let’s say a loyalty program member stays 3 nights with a hotel and is rewarded with a free night, as part of the hotel’s promotional deal. Revenue isn’t recognized from the free night until it is actually used by the customer. In other words, transactions associated with the free night remain deferred until the customer utilizes the promotional reward and stays at the hotel.

Now that you understand the future utilization of outstanding points as of a given evaluation date, it’s time to predict the outcome of points that have yet to be earned.
Predicting future behavior starts with forecasting the pattern of future points earned by current members for each month, extending out several years. For the best results, these forecasts should be calculated at the individual member level. When paired with an estimate of revenue per earned point, this will produce an estimate of future revenue for each member, which is the first component of customer future value (CFV), a key metric for program optimization.
In the same way, the pattern of future points redeemed and expired for each current member can be predicted. Note that these patterns will include the redemption and expiration of points that haven’t been earned as of the current evaluation date. This is a key difference from Step 1 and provides a fuller picture of the expected future redemption costs.

Also essential to this analysis is predicting ultimate redemption rate, cost per point (CPP), and fair value per point (FVPP) of the earned points forecasted in Step 2.
When multiplied, future earned points, URR, and FVPP represent the amount of revenue that will need to be deferred in future periods.
The product of future earned points, URR, and CPP equals the expected future redemption cost (the second component in the CFV equation).
Taken together, Steps 1 through 3 provide a strong foundation for loyalty program liability budgeting with existing members. Steps 1 and 2 provide month by month forecasts of point transactions, while Step 3 projects the ultimate outcome of points earned in each of the upcoming periods for current members.

Ultimately, accurately forecasting your program liability requires two things: (1) understanding current member behavior and (2) predicting future member behavior.
Similar to how we determine current member behavior, predicting future member behavior requires we look at the following:
It’s no secret that loyalty programs generate large amounts of data. Predictive modeling can help you draw actionable insight into each of these aforementioned metrics, while giving you the required understanding to make important decisions about your program strategy as a whole.
Build your model from the bottom up, taking a member and channel-specific approach:
Segmenting by join channel allows for projecting different scenarios of member growth by channel. Forecasts of member growth by channel are common throughout the loyalty industry, and channel data can provide insights into expected member behavior when transactional data is limited or non-existent.
For example, in some programs, members who join via offline channels earn fewer points and have a higher breakage rate than members who join through other channels. If a program intends to scale down its acquisition spend for offline channels, program leaders should expect the overall breakage of points earned in the future to decrease.
Analytics at the individual member level will offer your team key insights into member behavior.
As an example, consider the ultimate redemption rate:
Ultimate Redemption Rate (URR) = Total points that will ultimately be redeemed / Total points issued
URR is weighted by total points. Even a small group of members, if they have have enough points, can have an outsized impact on the overall URR. Members who earn more points tend to have a higher URR. Over time, as these power users earn a larger share of the total points, the overall URR is pushed up. This phenomenon is known as mix shift.
When members first join, however, the share of points between casual and power users is more evenly distributed.
For example: suppose Larry (a casual user) and Amy (a power user) are the only two members who join in a given month:
[table id=26 /]
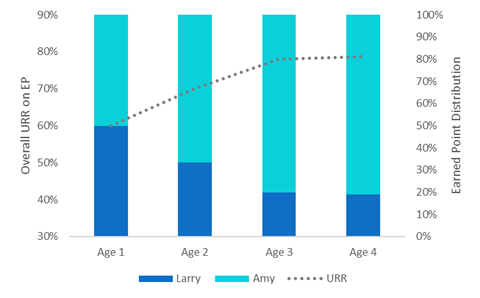
Cumulative URR increases over time as power user mix increases
The overall URR for the join month starts at 60%, when both the casual and power user have earned a similar share of points. However, notice how the URR increases over time as Amy, a power user, earns a significant share of the overall points.
Viewed on a larger scale, your program URR should follow a similar pattern.

We’ve discussed evaluating current and future member behavior. But to truly see the “big picture” of your loyalty program data, we need to combine current and future earned points — and members — to produce a complete forecast of revenue and costs.
In steps 1-4, we calculated the ultimate redemption rate (URR), cost per point (CPP), and fair value per point (FVPP). These estimates for current and future members serve as inputs for financial statement items and program optimization metrics.
After forecasting behavior metrics for your loyalty program members, it’s time to turn your attention to the actual financial statement. On public financials, the loyalty program liability receives the most attention. FVPP and URR are key inputs to estimating your financial liability (reported on financial statements), while CPP is essential for estimating your economic liability (actual future costs to your program).
Breakage = 1 - URR
Loyalty program financial liability = Outstanding points x (1 - breakage) x FVPP
Loyalty program economic liability = Outstanding points x (1 - breakage) x CPP
Many of the metrics discussed serve as inputs towards calculating your loyalty program liability. Conveniently, optimizing your program relies on many of the same metrics.
Ultimately, you want to be maximize your loyalty program ROI. Customer lifetime value (CLV) is a reliable measurement. If it’s increasing, your program is likely driving increased customer engagement that encourages revenue growth.
Pulling these metrics together into a coherent portrait of your program’s financial future can be daunting, however. Our downloadable guide provides you with a framework to put the pieces together. It takes you through each step - estimating member growth, projecting the behavior of new members, and forecasting the outcomes for current members - to create a long-term view of key loyalty program cash flows. Additionally, it allows for scenario testing, giving you actionable insight into the effects of various member acquisition strategies.
Strategizing and reporting reliable loyalty program liability estimates is a complicated undertaking. Reportable deferred revenue relies on accurate actuarial analysis requiring sound estimates for many program metrics.
Bottom-up predictive modeling can build a reliable, robust financial forecast for liability budgeting. It starts with segmenting your members by behavior, calculating relevant program metrics, and considering future member behavior.
To improve your program liability budgeting, take the five steps we’ve outlined in this article:
Step 1: Predict point “runoff” for current members
Step 2: Predict future point-earning behavior of current members
Step 3: Predict the point behavior, URR, CPP, and FVPP for future members
Step 4: Predict point transactions, URR, CPP, and FVPP for future members
Step 5: Bring it all together
Ultimately, the goal is to build an accurate financial forecast of both member behavior and program liability.
But the benefits extend far beyond predicting where your program is headed. Such analysis gives you the insight needed to optimize your loyalty program — not only improving customer engagement, but increasing its ROI.

Comments